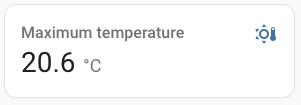
Statistic card
The statistic card allows you to display a statistical value for an entity.
Statistics are gathered every 5 minutes for sensors that support it. It will either keep the min, max and mean of a sensors value for a specific period, or the sum for a metered entity.
If your sensor doesn’t work with statistics, check this.
 Screenshot of the statistic card for a temperature sensor.
To add the statistic card to your user interface:
- In the top right of the screen, select the edit
button. - If this is your first time editing a dashboard, the Edit dashboard dialog appears.
- By editing the dashboard, you are taking over control of this dashboard.
- This means that it is no longer automatically updated when new dashboard elements become available.
- Once you’ve taken control, you can’t get this specific dashboard back to update automatically. However, you can create a new default dashboard.
- To continue, in the dialog, select the three dots
menu, then select Take control.
- If this is your first time editing a dashboard, the Edit dashboard dialog appears.
- Add a card and customize actions and features to your dashboard.
All options for this card can be configured via the user interface, but if you want more options for the period, you will have to define them in yaml.
Configuration Variables
Overwrites friendly name. Can be a string, or a name configuration object. See naming documentation.
Unit of measurement given to data.
Unit of measurement given by entity.
The period to use for the calculation. See below.
Override the used theme for this card with any loaded theme. For more information about themes, see the frontend documentation.
Footer widget to render. See footer documentation.
If using period: energy_date_selection, you can set a custom key to match the optional key of an energy-date-selection card. This is not typically required, but can be useful if multiple date selection cards are used on the same view. See energy documentation.
Example
Alternatively, the card can be configured using YAML:
type: statistic
entity: sensor.energy_consumption
period:
  calendar:
    period: month
stat_type: change
Options for period
Periods can be configured in 4 different ways:
Calendar
Use a fixed period with an offset from the current period.
Example, the change of the energy consumption during last month:
type: statistic
entity: sensor.energy_consumption
period:
  calendar:
    period: month
    offset: -1
stat_type: change
Fixed period
Specify a fixed period, the start and end are optional.
Example, the change in 2022:
type: statistic
entity: sensor.energy_consumption
period:
  fixed_period:
    start: 2022-01-01
    end: 2022-12-31
stat_type: change
Example, all time change, without a start or end:
type: statistic
entity: sensor.energy_consumption
period:
  fixed_period:
stat_type: change
Rolling window
Example, a period of 1 hour, 10 minutes and 5 seconds ending 2 hours, 20 minutes and 10 seconds before now:
type: statistic
entity: sensor.energy_consumption
period:
  rolling_window:
    duration:
      hours: 1
      minutes: 10
      seconds: 5
    offset:
      hours: -2
      minutes: -20
      seconds: -10
stat_type: change
Dynamic date selection
When placed on a view with an Energy date selection card, the statistic card can be linked to show data from the period selected on the date selection card.
Example of a period from the date selector:
type: statistic
entity: sensor.energy_consumption
period: energy_date_selection
stat_type: change